
How do wearables measure stress?
By timing your heartbeats. An optical sensor shines light into the skin and records how the reflected signal pulses, which gives the device the interval between one beat and the next. From those intervals it derives two things: heart rate, and heart-rate variability, the small differences in the gaps between beats. Both are then compared against your own recent history rather than against a population range.
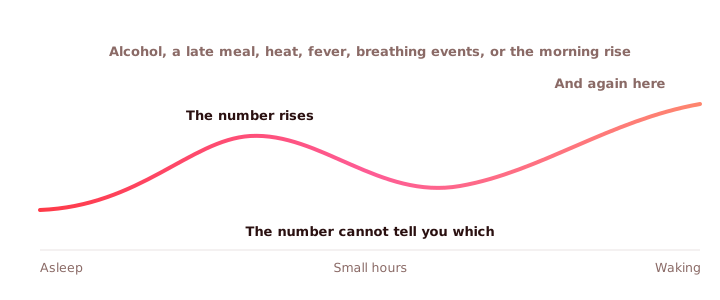
That comparison is the whole trick. Nobody ships a fixed threshold for stress, because there is no such thing. Oura states the position plainly in its Daytime Stress support article: "Oura does not use fixed thresholds for stress. Your scores are relative to you." WHOOP compares your current reading against your personal baseline from the past 14 days. Garmin's support site says a new or factory-reset device needs roughly 5 to 7 days before Body Battery and all-day stress tracking have a baseline to work from.
Some devices add inputs. Oura includes motion and average body temperature. Google's Health app help page includes electrodermal activity, which it defines as "tiny changes in the sweat level of your skin", noting in the same sentence that those changes "may be due to stress or other factors such as movement, noise, or temperature variations". Every device also uses motion as a gate, because a raised heart rate during a workout is not the thing the feature is trying to catch.
The sensor measurement is genuine. The label on top of it is a model. That distinction runs through this whole page, and it is the same distinction at issue in the sleep-staging lawsuit filed against Oura in August 2026, where the argument is about what a claim of accuracy can mean when the thing being claimed is a prediction. If you want the physiology of why a heartbeat-derived signal is not a hormone, that argument lives on cortisol vs HRV, and the device-by-device sensor inventory lives on what the Apple Watch, WHOOP, Oura and Garmin actually sense.
What each company's number is made of
Here is each feature as its maker describes it. The product names are the companies' own, and the last column is what each company says its number cannot do, taken from the same pages.
| Feature | What the company says it is computed from | What it reports | When the company says it is not measured, or not valid |
|---|---|---|---|
| Oura Daytime Stress | Heart rate, heart-rate variability, motion and average body temperature, against a personal baseline recalibrated daily | Four zones: Stressed, Engaged, Relaxed, Restored. Updates every 15 minutes while you are awake, wearing the ring and relatively inactive | Not measured during movement or during sleep. Needs about 5 days of continuous wear first. Oura says it cannot differentiate different stress sources, and that results may not be valid for people with heart disease, neurodegenerative disease or a pacemaker |
| Oura Resilience | Daytime stress load, daytime recovery and nighttime recovery, averaged over 14 days | Five levels: Exceptional, Strong, Solid, Adequate, Limited | Needs at least 5 days of complete data within the past 14, and about 10 days for a new member. Changes about 2 to 3 times a month |
| Oura Cumulative Stress | Five contributors over 31 days: sleep continuity, heart stress-response, sleep micromotions, temperature regulation and activity impact | A weekly rating of low, moderate or high | Needs 21 days of data from the last 31. Oura says readings may not be accurate with cardiovascular conditions, in the first trimester of pregnancy, or after starting medications that shift resting heart rate or temperature |
| WHOOP Stress Monitor | Heart rate and heart-rate variability in the moment, compared against your personal baseline from the past 14 days, with motion taken into account to separate exercise from other stressors | A real-time value from 0, low stress, to 3, your peak stress level | WHOOP states that its features "are not intended to diagnose, monitor, treat, cure, or prevent any disease or condition" and that no conclusion about mental health should be drawn from them |
| Garmin Stress level | Heart-rate variability, which Garmin describes as regulated by the autonomic nervous system. Higher stress means less variability between heartbeats | 0 to 100, in four bands: 0 to 25 resting, 26 to 50 low, 51 to 75 medium, 76 to 100 high | Not recorded during high activity, where periods are labelled "Unmeasurable". A new or reset device needs about 5 to 7 days to establish a baseline |
| Google Health app Resilience score (Fitbit and Pixel Watch) | Three contributors: Responsiveness, from heart rate, heart-rate variability and electrodermal activity where available; Exertion balance; and Sleep patterns | A daily qualitative rating of your capacity for the day ahead | Requires a Pixel Watch or Fitbit device sending heart-rate data to the app. Google says the separate Body responses feature "do not track overall perceived stress levels, just sudden and rapid increases in your 'fight or flight' system" |
| Samsung Galaxy Stress | Bio-data collected at the wrist, either continuously or on demand, depending on the measurement setting you choose | A stress level shown in the Samsung Health app, with guided breathing beside it | Samsung says stress levels "may not be measured during sleep, workouts, or excessive movement", and that they "may not reflect emotional states due to physiological factors like physical activity or rest" |
A wider table, covering recovery and hormone features as well as stress, with a source and date for every row, is at what your wearable actually measures. Feature descriptions are the manufacturers' own, read on 16 September 2026. Oura's Daytime Stress article was last updated 13 August 2026, its Resilience article 29 May 2026, and its Cumulative Stress article 6 July 2026. Google's Health app help page has replaced much of the older Fitbit stress documentation, and the Stress Management Score described in Google's 2023 engineering post, calculated "once per day, after you wake up", is the ancestor of the Resilience score documented now. The Samsung wording is from its Galaxy Fit3 support page.
Why does my wearable say I am stressed when I feel fine?
Because it is not measuring how you feel, and every company says so. The feature detects physiological arousal, which is a different quantity from distress, and the two come apart constantly.
Oura writes, in its Daytime Stress article: "Your Daytime Stress score reflects your body's physiological response, which may not always match how you feel. Stress is measured based on your biometrics, not your emotions." Google, describing its Body responses feature, says the alerts are "generated when your physiological signals indicate a sudden and rapid increase in autonomic nervous system activity", and lists the causes as including "quickly standing up, brief walks, eating, caffeine or onset of illness". Samsung says its readings "may not reflect emotional states".
Oura is the most direct about the limit, and the sentence is worth reading twice:
"Daytime Stress cannot differentiate different stress sources, as the body physiologically reacts the same way to different stressors, whether it's physical or mental."
Oura Member Care, Daytime Stress, last updated 13 August 2026
That is the honest description of every device in the table. Your circulation responds to a deadline, a double espresso, a flight of stairs, a cold room and a virus with overlapping changes in heart rate and beat-to-beat variability. A model watching only those changes can tell you that something moved. It cannot tell you which something, and it was never built to.
Why is my stress reading high while I sleep?
Because the number tracks autonomic arousal, and a night is full of arousal. It is the most asked and least answered question in the category, so here is the mechanism first, then the causes.
First, the part that is not a graph problem
Most overnight arousal is ordinary. A few patterns are worth a clinician rather than a forum, and they are worth naming before the explanations, because the explanations are the part people stop reading after.
- Chest pain or pressure, sudden breathlessness, fainting, or pain spreading to the arm, jaw or back. Call emergency services now and say those words. Do not wait to check a graph, and do not let a calm reading talk you out of it. No consumer wearable is built to detect a heart attack.
- Gasping, choking, or someone telling you that you stop breathing. Ask a doctor about a sleep assessment. Benjafield and colleagues estimated that 936 million adults aged 30 to 69 have mild to severe obstructive sleep apnoea worldwide, and 425 million have moderate to severe. Not snoring does not rule it out, and neither does a normal-looking night on your app.
- A fever with a fast resting pulse, or a pulse that stays high for days. Take it to a clinician rather than to your tracker. And the reverse does not hold: a normal temperature does not rule out an infection, because plenty of infections run without much fever, and some medicines blunt the fever response.
- A pulse that feels irregular, or palpitations that wake you. Worth a clinician's opinion. A stress feature is not a rhythm check, and none of the products above is offered as one.
A calm stress reading is not evidence that nothing is wrong. It is the absence of a signal from a model that was never designed to look for these things, which is a different statement entirely.
What a night actually does to the autonomic system
Sleep is not one state, and the nervous system is not quiet through it. Somers and colleagues measured sympathetic nerve traffic directly, with microneurography, in 8 healthy adults across the stages of sleep, and reported that burst activity fell to 41% of waking levels in deep non-REM sleep and rose to 215% of waking levels during REM sleep, with blood pressure and heart rate returning to roughly waking values. They also found that arousal stimuli during lighter sleep produced bursts of sympathetic activity and transient rises in blood pressure.
So a device that grades arousal minute by minute will paint most of a normal night in bands, not in a flat line. REM comes in longer blocks toward morning, which is one reason the second half of the night often looks busier on a stress graph than the first.
What raises it further, and how to test each one
On top of the normal pattern, a specific list of things drives heart rate up or beat-to-beat variability down overnight. Garmin publishes its own version of this list on the Body Battery support page, under the question of why the number can be low after a full night: bright lights, alcohol consumption, excessive physical activity, physical exhaustion, extreme temperatures, loud noises, pain or discomfort, illness, and frequent waking, tossing, or turning during sleep.
| What was going on | What the device sees | How to check it on your own data |
|---|---|---|
| A drink in the evening | Higher heart rate and lower variability in the first hours of sleep, dose-dependent | Compare a night with and a night without, same bedtime. Then move the last drink 3 hours earlier and compare again |
| A late or hard training session | Raised nocturnal resting heart rate and lower nocturnal heart-rate variability | Compare a morning session with an evening one at similar effort, and look at the gap between finishing and falling asleep |
| A late meal | A shift in the balance of the two heartbeat rhythms for roughly an hour after eating | Log the time of your last meal for a week and read it against the first hour of each night |
| A fever, or an infection starting | A higher resting heart rate across the whole night, often before you feel ill | Read it beside your temperature, not instead of it. A run of unexplained high nights is a clinician's question |
| Interrupted breathing | Repeated arousals and surges through the night rather than one smooth curve | Not a self-test. Ask about a sleep assessment, particularly with witnessed pauses or morning headaches |
| Heat, light, noise, pain | Fragmented sleep with arousal bursts, which Garmin lists among its own stress factors | Change one variable at a time. Room temperature is the easiest to test and the most often ignored |
Alcohol. Pietilä and colleagues studied 4,098 Finnish employees who recorded beat-to-beat intervals through normal life, comparing each person's own nights with and without alcohol. Intake was associated with increased sympathetic regulation and decreased parasympathetic regulation during the first 3 hours of sleep, in a dose-dependent way, and their heart-rate-derived measure of physiological recovery fell by an average of 9.3, 24.0 and 39.2 percentage units at low, moderate and high intake. Low here meant 0.25 g of pure alcohol per kg of body weight or less, which is a small drink for most adults. The authors note that regular physical activity and young age did not protect against the effect. Two of the authors were employed by Firstbeat Technologies, whose analytics sit behind Garmin's stress feature, which is worth knowing when reading a paper about heart-rate-derived recovery.
A late or hard session. Leota and colleagues analysed 4,084,354 person-nights from 14,689 physically active people wearing a biometric device, and reported that later exercise timing and higher exercise strain were associated with delayed sleep onset, shorter sleep, higher nocturnal resting heart rate and lower nocturnal heart-rate variability. Sessions that ended 4 or more hours before sleep onset were not associated with changes in sleep, regardless of strain. Two of that study's authors were affiliated with WHOOP, whose device supplied the data. In a much smaller controlled study, Yamanaka and colleagues found that evening exercise raised heart rate during the following night's sleep while morning exercise did not, which points the same way by a different route.
A late meal. Lu and colleagues recorded 9 healthy volunteers before and after a 500-calorie meal and found the balance between the low and high frequency components of heart-rate variability shifted for a sustained hour afterwards, mainly through a drop in the high-frequency component. That is a small study, and the ratio it used is a disputed index of autonomic balance rather than a clean readout of it, so treat it as a direction rather than a dose. Google's own list of things that trigger a Body response includes eating, which is the same observation from the other side.
A fever. Jensen and colleagues measured 4,493 acutely admitted medical patients and found heart rate rose by 7.2 beats per minute for each degree Celsius of body temperature, or 6.4 after adjusting for age, oxygen saturation and blood pressure. They described the association as modest, which it is, and it is more than enough to move a number that is scored against your own baseline. This is why a tracker often flags a bad night before you notice you are coming down with something, and it is also why that flag says nothing about which something.
Interrupted breathing. Each apnoea ends in an arousal, and Abboud and Kumar, reviewing two decades of direct nerve recordings in obstructive sleep apnoea, describe alarming nocturnal oscillations in arterial pressure and sympathetic nerve activity driven by the coupling between apnoea, ventilation and nerve traffic. A stress graph cannot see a breathing event. It can only see the arousal that follows one, which is a reason a fragmented-looking night is worth mentioning to a doctor rather than to a subreddit.
And the end of the night is a hormonal event. Cortisol is not flat while you sleep. StatPearls describes the rhythm as beginning to rise during the final hours of sleep, peaking near the time of awakening, and reaching its lowest concentration at night. Your tracker is not reading that hormone. It reads the heartbeat, on a body that is already preparing to be awake. The full picture of how the hormone and the night run into each other is on cortisol and sleep.
Why do two devices disagree about the same night?
Because they are not computing the same quantity, and there is no unit to convert between them. Four things differ at once.
- The baseline. Oura recalibrates yours daily. WHOOP compares against your last 14 days. Oura's Resilience averages 14 days and its Cumulative Stress reads 31. A quiet fortnight moves the reference point under all of them.
- The window. Oura does not calculate Daytime Stress while you sleep at all, and says so in its troubleshooting list. Garmin tracks stress through the night, which is precisely why the question in the heading is asked about Garmin more than about anyone else. Samsung says its measurement may not run during sleep.
- The scale. WHOOP reports 0 to 3. Garmin reports 0 to 100 in four bands. Oura reports four named zones. Google's Resilience score is qualitative. None of these maps onto another.
- The sensor and its site. A finger and a wrist do not produce equally clean pulse signals, and fit matters enough that Oura lists cold hands and a loose ring among the reasons your graph has gaps in it.
Two devices can therefore each be internally consistent, each be honestly described by its maker, and still tell you different stories about the same Tuesday night. That is not a defect in either one. It is what happens when a word from ordinary language is used as the name of a computed quantity.
Does a high stress reading mean my cortisol is high?
No. A stress reading is arithmetic on your heartbeat. Cortisol is a molecule made by the adrenal glands, released on a daily rhythm, and moved by more than stress. The two travel on different timescales, and a change in one does not reliably predict a change in the other. The full evidence on that, including what happens in studies that measure both at once, is on cortisol vs HRV, and the hormone's own behaviour under pressure is covered in cortisol and stress. The short version for this page: your device is reporting your nervous system, not your endocrine system, and it is not claiming otherwise.
What these numbers are good for
This page is skeptical of the label, not of the instrument. Used for what it is, an arousal log is genuinely useful.
- Testing one variable against yourself. Two weeks with the last drink at 18:00 against two weeks with it at 22:00 is a real experiment, and the device is a reasonable instrument for it.
- Catching the thing you were not going to notice. A run of high overnight readings before a cold arrives is a real observation, even if the number cannot name the cause.
- Making a pattern visible over weeks. Trends against your own history are the strongest claim any of these features makes, and the companies mostly say that themselves.
- Prompting a question for a clinician. "My resting heart rate has been 10 beats higher every night for three weeks" is a useful sentence in an appointment. "My stress was orange" is not.
What these numbers cannot see
The honest list is short, and every item on it comes from the manufacturers' own documentation rather than from us.
- The cause of the arousal. Oura: the body reacts the same way to different stressors, physical or mental.
- Your experience. Oura: measured from biometrics, not emotions. Google: Body responses do not track overall perceived stress.
- A hormone. None of these devices samples a molecule. WHOOP's own post makes the distinction in passing, noting that stress can be self-reported or "measured with biomarkers, like cortisol", and then describing a feature built on heart rate and heart-rate variability.
- A diagnosis. WHOOP states its features are not intended to diagnose, monitor, treat, cure or prevent any disease or condition. Oura lists conditions under which its stress results may not be valid. These are not disclaimers bolted on by lawyers, they are accurate descriptions of the instrument.
If you are choosing between devices on this basis, the side-by-side comparison of cortisol wearables and lab tests sets out which instrument reads which signal, and the measurement hub covers the sample-based options.
Where a hormone reading fits
I build a cortisol sensor, so state my interest before reading the next paragraph.
The Auromone Curve is designed to measure cortisol continuously from a trace of sweat at the wrist. It computes no stress number, it scores nothing, and it never tells anyone that a reading is abnormal. It is designed to report the hormone and show you the shape of your own day, which has a well-described daily rhythm: rising in the final hours of sleep, highest near waking, lowest at night. Stress is one of the things that moves cortisol. It is not the only one, and the page on cortisol and stress covers the rest.
That is a different measurement from a heart-derived stress estimate, not a better one and not a replacement for one. A stress feature answers a question about your nervous system minute by minute, which a hormone reading cannot answer. A cortisol reading answers a question about a hormone concentration, which a heartbeat cannot answer. Anyone selling you the idea that one of these is the true version of the other, including anyone selling a cortisol sensor, is overselling.
References
- Oura. Daytime Stress. Oura Member Care, last updated 13 August 2026. (Heart rate, HRV, motion and average body temperature; the four zones; 15-minute updates while awake and inactive; "Oura does not use fixed thresholds for stress"; not measured during movement or sleep; five days of wear to calibrate; "cannot differentiate different stress sources"; validity caveats for heart disease, neurodegenerative disease and pacemakers.)
- Oura. Resilience. Oura Member Care, last updated 29 May 2026. (Daytime stress load, daytime recovery and nighttime recovery over a 14-day average; the five levels; data requirements.)
- Oura. Cumulative Stress. Oura Member Care, last updated 6 July 2026. (31-day window, weekly update, the five contributors, and the conditions under which readings may not be accurate.)
- WHOOP. Introducing Stress Monitor: a new way to monitor and manage stress. 29 March 2023. (Heart rate and HRV against a personal 14-day baseline, motion taken into account, a 0 to 3 scale; "measured with biomarkers, like cortisol"; the notice that WHOOP features "are not intended to diagnose, monitor, treat, cure, or prevent any disease or condition".)
- Garmin. What is the stress level feature on my Garmin device? Garmin Customer Support. (HRV basis; 0 to 100 with bands at 0 to 25, 26 to 50, 51 to 75 and 76 to 100; stress not recorded during high activity and labelled "Unmeasurable"; Stress Balance data requirements.)
- Garmin. Body Battery frequently asked questions. Garmin Customer Support. ("Even if you sleep through the night, elevated stress levels during sleep can reduce how much your Body Battery recharges", with the list of factors that may increase stress levels; the 5 to 7 day learning period.)
- Google. Manage stress and mindfulness in Google Health. Google Health Help. (The Resilience score's three contributors, Responsiveness, Exertion balance and Sleep patterns; the definition of electrodermal activity; "Body Responses do not track overall perceived stress levels, just sudden and rapid increases in your 'fight or flight' system", with causes including quickly standing up, brief walks, eating, caffeine or onset of illness.)
- Perez E, Abdel-Ghaffar S. How we trained Fitbit's Body Response feature to detect stress. Google, 2 June 2023. (The Stress Management Score "is calculated once per day, after you wake up" from the previous night, day and week; the cEDA sensor; the algorithm disabled during detected exercise.)
- Samsung. How to measure and manage stress with Samsung Galaxy Fit3. Samsung Support, last updated 1 July 2026. (Bio-data collection; Measure Continuously versus Manual Only; "Stress levels may not be measured during sleep, workouts, or excessive movement"; "may not reflect emotional states due to physiological factors like physical activity or rest".)
- Somers VK, Dyken ME, Mark AL, Abboud FM. Sympathetic-nerve activity during sleep in normal subjects. N Engl J Med. 1993;328(5):303-307. (n = 8; burst amplitude 41 ± 9% of waking in stage 4 non-REM and 215 ± 11% during REM; arousal stimuli producing sympathetic bursts and transient blood-pressure rises.)
- Pietilä J, Helander E, Korhonen I, Myllymäki T, Kujala UM, Lindholm H. Acute effect of alcohol intake on cardiovascular autonomic regulation during the first hours of sleep. JMIR Ment Health. 2018;5(1):e23. (n = 4,098; dose-dependent increase in sympathetic and decrease in parasympathetic regulation; recovery state down 9.3, 24.0 and 39.2 percentage units at low, moderate and high intake; low defined as ≤0.25 g/kg. Two authors employed by Firstbeat Technologies.)
- Leota J, Presby DM, Le F, et al. Dose-response relationship between evening exercise and sleep. Nat Commun. 2025;16:3297. (14,689 people, 4,084,354 person-nights; later timing and higher strain associated with higher nocturnal resting heart rate and lower nocturnal HRV; no association when exercise ended ≥4 hours before sleep onset. Two authors affiliated with WHOOP, which supplied the data.)
- Yamanaka Y, Hashimoto S, Takasu NN, et al. Morning and evening physical exercise differentially regulate the autonomic nervous system during nocturnal sleep in humans. Am J Physiol Regul Integr Comp Physiol. 2015;309(9):R1112-21. (Heart rate increased during nocturnal sleep after evening exercise; parasympathetic indices increased after morning exercise.)
- Lu CL, Zou X, Orr WC, Chen JD. Postprandial changes of sympathovagal balance measured by heart rate variability. Dig Dis Sci. 1999;44(4):857-861. (n = 9; a 500-kcal meal; the low-to-high frequency ratio raised for a sustained hour, mainly through a fall in the high-frequency component.)
- Jensen MM, Kellett JG, Hallas P, Brabrand M. Fever increases heart rate and respiratory rate. Acute Med. 2019;18(3):141-143. (n = 4,493 acutely admitted medical patients; heart rate rose 7.2 ± 0.4 beats per minute per degree Celsius, 6.4 ± 0.4 after adjustment; the authors call the association modest.)
- Abboud F, Kumar R. Obstructive sleep apnea and insight into mechanisms of sympathetic overactivity. J Clin Invest. 2014;124(4):1454-1457. (Nocturnal oscillations in arterial pressure and sympathetic nerve activity driven by coupling among nerve activity, apnoea and ventilation; high sympathetic activity persisting during wakefulness.)
- Benjafield AV, Ayas NT, Eastwood PR, et al. Estimation of the global prevalence and burden of obstructive sleep apnoea. Lancet Respir Med. 2019;7(8):687-698. (936 million adults aged 30 to 69 with mild to severe obstructive sleep apnoea, 425 million with moderate to severe; funded by ResMed.)
- Kaur J, Gandhi J, Sharma S. Physiology, Cortisol. StatPearls. (Secretion follows a diurnal rhythm, with levels beginning to rise during the final hours of sleep, peaking near the time of awakening, and declining to the lowest concentration at night.)
These features change without notice, so check the linked page before relying on a detail. Where a manufacturer's site blocked automated access, the page was read through a text-extraction proxy of the same public URL. No figure on this page describes the Auromone Curve, which has no published performance data.
