
What can a low recovery score not tell you?
Whether you are safe. That belongs at the top of this page rather than the bottom, because two kinds of reader arrive here on the same morning: one whose device says something alarming, and one whose device says nothing while they feel alarming anyway. The number is a model of your heartbeat compared with your own recent history. It is not triage in either direction.
Before the physiology, the part that is time-sensitive
A green score does not rule out a heart attack, and a red one does not diagnose anything. No consumer wearable is designed to find one. The NHS lists these as reasons to call emergency services immediately, and in Canada that is 9-1-1:
- Chest pain that feels tight, crushing or squeezing, or that spreads to your arm, neck or jaw
- Severe difficulty breathing, gasping, choking, or being unable to get words out
- Skin that has turned pale, blue or grey, which on brown or black skin may be easier to see on the palms
- Someone who has passed out and is not responding normally
The NHS adds that you should not drive yourself, and that sudden new breathlessness, or chest pain with nausea or with a racing, slow or fluttering heartbeat, needs urgent advice the same day. MedlinePlus puts the same line under breathing: go to the emergency room if difficulty breathing comes on suddenly or interferes with breathing or talking.
The most dangerous version of this page's question is "my score has been red since I had a virus." The app's advice and the mistake are the same action, which is to rest and try again tomorrow. MedlinePlus describes myocarditis, inflammation of the heart muscle, as often caused by a virus reaching the heart, and lists chest pain that may resemble a heart attack, fatigue, fever, rapid breathing, rapid heart rate, shortness of breath, leg swelling and fainting among its symptoms. It also says plainly that myocarditis "can be hard to diagnose because the signs and symptoms often mimic those of other heart and lung diseases, or a bad case of the flu." Cleveland Clinic describes people with myocarditis as often feeling fatigued, short of breath, and aware of their heart racing, gradually or very quickly. A tracker will show you exactly that picture and call it poor recovery.
So the action, not the fear: chest pain, trouble breathing or fainting means call 9-1-1 now, whatever your score says. Unusual fatigue with palpitations, an irregular pulse, swollen legs or feet, or being unable to do exercise you could do a month ago needs a same-day medical assessment, not a lighter training week. Do not train through it while you wait.
And do not let a missing sign become the all-clear. Fever is a common sign of infection and it is not a required one: in Fitbit researchers' data on 2,745 people with confirmed COVID-19, fever was reported by 59.4% of men and 52% of women, so roughly half did not report it. A device that has not alerted you has not excluded anything either. If you are in distress or thinking about harming yourself, the number on your wrist is irrelevant: in Canada, call or text 9-8-8, the Suicide Crisis Helpline, 24 hours a day.
One framing note, because a title can quietly exclude the people it is for. This page is not only for WHOOP owners, and not only for athletes. If your device shows you a Readiness Score, a Recovery percentage, a Training Readiness number, a Body Battery level, a sleep score or any other morning figure that claims to know how ready you are, this page is about you. The mechanics are close to identical across brands, and the disagreements between them are the interesting part.
What is a recovery score actually calculated from?
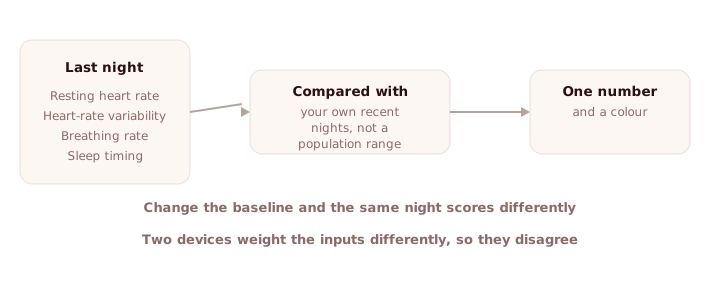
A small set of overnight body signals, compared against your own recent history, combined with weights the maker does not publish. The signals are resting heart rate, heart-rate variability, breathing rate, skin temperature, and the timing and amount of your sleep. What differs between brands is which of those they use, how far back the comparison reaches, and what else gets folded in, such as yesterday's training load.
Here is what each company says, from its own documentation as of September 2026.
| Number | Scale | Inputs the maker names | Compared against |
|---|---|---|---|
| Oura, Readiness Score | 0 to 100, with 85 and above Optimal, 70 to 84 Good, 60 to 69 Fair, 59 and below Pay attention | Nine contributors: resting heart rate, HRV Balance, body temperature, Recovery Index, Sleep, Sleep Balance, Sleep Regularity, Previous Day Activity, Activity Balance | Your own averages. The balance contributors weigh a 14-day average against your average over the past two to three months |
| WHOOP, Recovery | 0 to 100%, calculated when you wake | Resting heart rate and heart-rate variability, plus blood oxygen and skin temperature for 4.0 members | Your own data. New accounts are flagged as calibrating, and a cycle with too little data is returned unscored |
| Garmin, Training Readiness | 1 to 100, in five colour zones from Poor at 1 to 24 up to Prime at 95 to 100 | Six factors: last night's sleep score, recovery time, HRV status, acute load, sleep history over the last 3 nights, stress history over the last 3 days | Your own history, updated through the day |
| Garmin, Body Battery | 5 to 100 | Heart-rate variability, stress level, sleep quality and activity data | Your own day, draining and charging as it goes |
Two things in that table do most of the work. First, everything is relative to you. Oura states that it can take up to two weeks for the app to learn your average values, and that once those ranges are established your daily readings are evaluated against them. WHOOP marks an account as calibrating until it has enough of your data. A low score is therefore a statement about a change, not about a level, and it is not comparable with your training partner's.
Second, the thresholds are tighter than most people assume. Oura says the resting heart rate contributor can decline when your overnight low sits 3 to 5 beats per minute above your usual average, or 10 to 15 beats below it. Its Recovery Index asks how long you slept after your heart rate reached its lowest point, and calls six hours or more optimal. A late night with an early alarm can lose points on several contributors at once, which is why a single ordinary Tuesday can produce a number that looks like a warning.
Why is my recovery score low this morning?
Almost always something that happened between mid-afternoon yesterday and the middle of last night. These are the usual candidates, with what each does to the inputs and where the figure comes from.
| What changed | What it does to the inputs | Source |
|---|---|---|
| Short sleep | In a crossover study of 20 men, a night cut to 5 hours raised heart rate and lowered variability measures against the same men's baseline nights, which the authors read as more sympathetic and less vagal tone | Scientific Reports, 2023 |
| Alcohol | Across 5.1 million person-days from 20,968 people, one drink above a person's own average was associated with nocturnal resting heart rate about 2.8 bpm higher in women and 2.4 bpm higher in men, with HRV about 3.8 ms and 3.3 ms lower. Drinking earlier in the day and sleeping longer afterwards reduced the effect | PLOS Digital Health, 2026 |
| A hard session close to bedtime | After vigorous exercise ending about 2 hours before bed, sleeping heart rate was higher (54 versus 51 bpm), concentrated in the first three hours, while whole-night HRV and subjective sleep quality were unchanged | Journal of Sleep Research, 2011 |
| A late meal, caffeine or a nightcap | Oura names late-night meals, caffeine, alcohol and exercise before bedtime as causes of a higher resting heart rate and of the heart rate reaching its low point later in the night | Oura, Readiness Contributors |
| A hot or cold bedroom | Oura says a room that leaves you hot or cold can push nighttime breathing rate up slightly in either direction, as the body works to compensate | Oura, Respiratory Rate |
| Dehydration | In 12 resistance-trained men, training while dehydrated reduced high-frequency power and raised the LF/HF ratio compared with the same men when hydrated | Journal of Sports Medicine and Physical Fitness, 2026 |
| Travel or a shifted schedule | Oura scores how consistent your bedtimes and wake times have been over the previous two weeks as its own contributor, so moving your night moves the score even if its length is unchanged | Oura, Readiness Contributors |
| Cycle phase | A 2026 living systematic review of 16 wearable studies reports HRV higher at the beginning of the cycle and lower toward the end, with time-domain differences of 3 to 9%, and lower values in hormonal contraceptive users | Sports Medicine, 2026 |
| An infection getting started | Fitbit researchers report that respiration rate and heart rate are typically elevated by illness while HRV is decreased. Oura says respiratory rate is likely to rise alongside resting heart rate, with HRV falling, when you are coming down with something | npj Digital Medicine, 2020; Oura |
| A new device, or a new baseline | Both Oura and WHOOP compare you with a personal history they have to build first. Oura says up to two weeks, and also notes that a replacement ring can take time to re-establish a temperature baseline | Oura; WHOOP developer documentation |
Notice how ordinary that list is. Nine of the ten entries describe a normal Wednesday, and the tenth describes a cold. A low score on a single morning is usually a record of yesterday evening, which is why the makers themselves point at behaviour rather than at pathology. Oura's own advice for a low Readiness Score is light movement and avoiding long stretches of sitting, not a doctor's appointment.
Two of those movers also move cortisol, in their own way and on their own schedule. Alcohol and a late session both land on the overnight hours when the hormone is meant to be at its lowest, which is the subject of how cortisol and sleep run into each other, and a schedule that moves your night is the whole problem described in night shift work and cortisol.
Why does my recovery score say rested when I feel wrecked?
Because the model is looking at five overnight signals and you are living in a whole body. The score can only be as wide as its inputs, and the list in the table above is the whole of it. A morning where the two disagree is not a malfunction. It is the gap between what a heartbeat reports and what a person experiences.
Things a heart-rate model does not see, and cannot:
- Pain, grief, dread and a bad week at work, unless they happen to move your pulse overnight
- An infection in its first hours, before it reaches the cardiovascular signals the device samples
- What you ate, what you drank today, and what medication you started after the overnight window closed
- Any hormone. There is no endocrine input to any of these scores, and adding one would not turn a model into a verdict either
The reverse case deserves the same care. A score that reads well while you feel wrecked is not permission, and a score that reads badly while you feel fine is not an injury. Feeling wrong is data. If it lasts more than a few days, take it to a clinician rather than to an app, and take the symptoms rather than the screenshot. Sleep researchers named orthosomnia for people who arrived in clinic seeking treatment for sleep problems they had diagnosed from tracker data, which is the failure mode at the far end of trusting the number over the body.
Why is my HRV low but my recovery score high?
Because the score is a weighted composite and heart-rate variability is one term in it. On Oura, HRV arrives through HRV Balance, which compares your 14-day average against your three-month average, with recent days weighted more heavily. A single unusual night is diluted by the 13 before it. Meanwhile a good sleep duration, an unremarkable temperature and a sensible previous day can each contribute points of their own.
Garmin's Training Readiness makes this even more visible: six factors, of which HRV status is one, sitting beside recovery time, acute load, sleep history over three nights and stress history over three days. A rested week can carry a rough night. Oura also notes an asymmetry worth knowing: body temperature only contributes when it sits outside your normal range, so it can lower your Readiness Score but never raise it.
The same arithmetic explains the opposite complaint, the low score with a normal-looking HRV. Something else in the stack moved, most often sleep timing, previous-day load, or temperature.
Why do two devices disagree about the same night?
Three reasons, and none of them requires either device to be broken.
- They are not reading the same inputs. WHOOP's Recovery object carries resting heart rate, HRV, and on 4.0 hardware blood oxygen and skin temperature. Oura's Readiness adds sleep regularity, previous-day activity and a two-week activity balance. Garmin's Training Readiness adds acute training load. Feed different variables into different models and you get different answers about one night's sleep.
- They are not using the same baseline window. Oura's balance contributors reach back two to three months. Garmin's Training Readiness looks at three nights of sleep history and three days of stress history. A month of hard training is ancient history to one of those and current events to the other.
- The underlying measurements themselves differ by device. Dial and colleagues ran five wearables against an ECG reference across 536 nights in 13 adults. For resting heart rate, Oura Generation 4 reached a concordance of 0.98 with a mean absolute percentage error of 1.94%, and WHOOP 4.0 reached 0.91 and 3.00%. For HRV, Oura Generation 4 reached 0.99 and 5.96%, WHOOP 0.94 and 8.17%, and the Garmin Fenix 6 0.87 and 10.52%, with Garmin excluded from the resting heart rate comparison over its undisclosed timestamp method.
That last point is the one people skip. Even before any scoring model runs, the two devices on your bedside table did not agree about the raw beats. The device-by-device version of that question is in what the Apple Watch, WHOOP, Oura and Garmin actually sense.
How accurate is a recovery score?
The inputs have an accuracy. The score does not. Resting heart rate and HRV can be compared against an ECG, which is what the study above did, and the answer comes out device-specific and firmware-specific. A recovery or readiness score has no equivalent reference, because there is no clinical gold standard for recovery to be measured against. There is nothing to be wrong about.
That is not a criticism dressed as physics. It is a category difference, and it matters for how you should read the number: an accuracy claim for a recovery score is undefined rather than unproven, which is the argument set out at greater length in why a recovery score cannot carry an accuracy figure. A trend against your own history is still a reasonable thing to watch. A single morning's number, treated as a measurement of your body's state, is asking more of it than it can give.
Where does a hormone sit next to a heart-rate model?
On a different axis, running on a different clock. A recovery score is computed from the autonomic nervous system's grip on your heart, which changes second to second. Cortisol is released through a slower chain, from the hypothalamus to the pituitary to the adrenal cortex, and it follows a daily rhythm of its own. The two are related, and they are not the same measurement, which is the subject of cortisol compared with a heartbeat-derived number.
There is a small study that shows the split cleanly. Twenty young men played a 90-minute football match at 21:30, and the following morning the researchers measured both the cortisol awakening response and heart-rate variability. The autonomic measures changed. The cortisol awakening response did not, at any of the four sampling points or in its area under the curve. One late hard session, one morning, two instruments, two different answers about it.
What that does not mean is that a hormone is the missing ingredient that would fix the score. It means the two signals describe different systems, and a morning where they disagree is information rather than an error. It is also worth being blunt about the limits on our side of the argument: no cortisol reading confirms or excludes overtraining, at any sampling rate, and our guide on cortisol and overtraining goes through the consensus statements that say so. If you train and you want the version written for that, it is in cortisol for athletes.
What should you actually do with a low score?
Treat it as a prompt to look at the last 24 hours, and then at the last two weeks. The number is most useful as a pattern and least useful as a morning verdict.
- Check the obvious inputs first. Bedtime, wake time, total sleep, alcohol, the timing of your last meal and your last hard effort, room temperature, fluids. The table above covers most low mornings.
- Read the contributors, not the headline. Every app shows which part of the composite dropped. A low score driven by temperature is a different story from a low score driven by sleep debt.
- Look at the week. One night sits inside a 14-day average on most platforms. A trend that has been sliding for two weeks is worth more of your attention than any single morning.
- Never change a prescribed medication because of a wearable number. Several drug classes move heart-rate variability on purpose. Take the reading to the prescriber instead.
- Let symptoms outrank the score in both directions. Urgent signs go to emergency services, and persistent fatigue goes to a clinician, whatever colour the app is showing.
If you want to compare what different instruments are actually reading before you buy another one, the rest of the measurement guides take the same approach: what the sensor touches, and what the model adds on top.
This guide is for general education only. The Auromone Curve is a general wellness device, not a diagnostic, and does not replace medical advice or clinical testing. Oura, WHOOP and Garmin product names are trademarks of their owners, and each feature is described here from that company's own published documentation as of September 2026. If you have symptoms that concern you, talk to a healthcare provider.
References
- Oura. Readiness Score, Oura Member Care, updated 14 July 2026. (0 to 100 scale and the four bands; overnight and long-term metrics; balance contributors using 14-day weighted averages against the past two months; menstrual cycle and pregnancy accounted for; the six factors that may decrease the score; heart-rate stabilisation within 3 bpm of the night's lowest; the light-movement advice.)
- Oura. Readiness Contributors, Oura Member Care, updated 14 July 2026. (The nine contributors; "It can take up to two weeks for the Oura App to learn your average values"; the 3 to 5 bpm higher and 10 to 15 bpm lower thresholds; "Late night meals, caffeine, alcohol, or exercise before bedtime"; HRV Balance comparing 14 days against a three-month average; Recovery Index and the six-hour figure; Sleep Regularity over two weeks.)
- Oura. Respiratory Rate, Oura Member Care, updated 13 May 2026. (Estimated from minute-by-minute changes in nighttime heart rate via respiratory sinus arrhythmia; 12 to 20 breaths per minute in healthy adults and night-to-night changes usually within 1 to 2; illness raising respiratory rate alongside resting heart rate with HRV falling; room temperature; vigorous exercise keeping respiration elevated for 20 to 40 minutes; cycle-phase differences.)
- Oura. Body Temperature, Oura Member Care, updated 24 April 2026. (Deviation from a personal baseline calculated over the first couple of weeks of wear; "body temperature can only lower your Readiness Score, not boost it"; illness and cycle phase; a replacement ring needing time to re-establish a baseline.)
- Oura. Resting Heart Rate, Oura Member Care, updated 14 July 2026. (PPG measurement every 10 minutes overnight; an individualised baseline collected over roughly two months; variation beyond 3 to 5 bpm named alongside illness, late-night eating and lack of sleep.)
- Oura. Your Oura Readiness Score, published 7 May 2026. (The three-pillar framing of sleep, activity and body stress, and the contributor questions. This post describes seven contributors; the support documentation updated in July 2026 lists nine, and this page follows the later count.)
- WHOOP. Recovery, WHOOP for Developers documentation. ("WHOOP Recovery is a daily measure of how prepared your body is to perform"; calculated on waking as a percentage between 0 and 100%; the recovery record carrying resting heart rate, HRV, and for 4.0 members blood oxygen and skin temperature; the calibrating flag and the unscorable state for insufficient data.) WHOOP's consumer site returned an automated-access error on both attempts made while writing this page, so WHOOP is described here only from its developer documentation.
- Garmin. Forerunner 965 Owner's Manual, Training Readiness. (Continuously calculated through the day from sleep score, recovery time, HRV status, acute load, sleep history over the last 3 nights and stress history over the last 3 days; the five colour zones from 1 to 24 Poor up to 95 to 100 Prime.)
- Garmin. Venu 3 Series Owner's Manual, Body Battery. (Heart-rate variability, stress level, sleep quality and activity data; the 5 to 100 range and its bands.)
- Garmin. Index Sleep Monitor Owner's Manual, Body Battery. ("Illness, alcohol consumption, and stress can prevent you from fully charging your Body Battery overnight.")
- Dial MB, Hollander ME, Vatne EA, Emerson AM, Edwards NA, Hagen JA. Validation of nocturnal resting heart rate and heart rate variability in consumer wearables. Physiol Rep. 2025;13(16):e70527. (13 adults, 536 nights, against an ECG reference; concordance and mean absolute percentage error by device for Oura, WHOOP, Garmin and Polar; Garmin excluded from the resting heart rate analysis.)
- Grosicki GJ, Robinson AT, Joyner MJ, et al. Real-world effects of alcohol on heart rate, sleep, and physical activity by age and sex. PLOS Digit Health. 2026;5(3):e0001284. (5,109,185 person-days from 20,968 participants; one drink above personal average associated with resting heart rate 2.8 bpm higher in females and 2.4 bpm in males, and HRV 3.8 ms and 3.3 ms lower; earlier drinking and longer post-drinking sleep attenuating the effect.)
- Schlagintweit J, Laharnar N, Glos M, et al. Effects of sleep fragmentation and partial sleep restriction on heart rate variability during night. Sci Rep. 2023;13(1):6202. (20 men, crossover; a 5-hour restriction night showed higher heart rate and lower pNN50 in stage N1 and lower SDNN during wakefulness against baseline; the authors conclude sleep restriction increases sympathetic and decreases vagal tone.)
- Myllymäki T, Kyröläinen H, Savolainen K, et al. Effects of vigorous late-night exercise on sleep quality and cardiac autonomic activity. J Sleep Res. 2011;20(1 Pt 2):146-153. (11 fit young adults; exercise to exhaustion ending 2 hours 13 minutes before bed; sleeping heart rate 54 ± 7 versus 51 ± 7 bpm, concentrated in the first three hours; no whole-night HRV difference; subjective sleep quality unchanged.)
- Ucar C, Ozgocer T, Yildiz S. Late-night exercise affects the autonomic nervous system activity but not the hypothalamo-pituitary-adrenal axis in the next morning. J Sports Med Phys Fitness. 2018;58(1-2):57-65. (20 male students; a 90-minute football match at 21:30; next-morning cortisol awakening response unchanged at 0, 15, 30 and 60 minutes and in area under the curve, while HRV parameters changed.)
- Natarajan A, Su HW, Heneghan C. Assessment of physiological signs associated with COVID-19 measured using wearable devices. NPJ Digit Med. 2020;3:156. (2,745 people with PCR-confirmed infection; "Respiration rate and heart rate are typically elevated by illness, while HRV is decreased"; fever reported by 59.4% of male and 52% of female subjects; AUC 0.77 for predicting illness on a specific day. Authors funded by Fitbit.)
- Radin JM, Wineinger NE, Topol EJ, Steinhubl SR. Harnessing wearable device data to improve state-level real-time surveillance of influenza-like illness in the USA. Lancet Digit Health. 2020;2(2):e85-e93. ("Acute infections can cause an individual to have an elevated resting heart rate"; 47,249 consistent Fitbit users across five states; elevated resting heart rate with increased sleep improved influenza-like illness prediction.)
- Hernández MI, Jiwan NC, Appell CR, et al. Dehydration reduces heart rate variability in recreationally resistance-trained men. J Sports Med Phys Fitness. 2026;66(8):949-958. (12 men, randomised hydrated and dehydrated conditions; dehydration reduced high-frequency power and raised low-frequency power and the LF/HF ratio.)
- de Jager E, Caulfield B, Angelidi E, MacNamee B, Holden S. Wearable-Derived Heart Rate Variability Across the Menstrual Cycle, Hormonal Contraceptive Use, and Reproductive Life Stages in Females: A Living Systematic Review. Sports Med. 2026;56(5):1153-1173. (16 studies; HRV higher at the beginning of the cycle and lower toward the end, with time-domain differences of 3 to 9%; lower values in hormonal contraceptive users, particularly in the late cycle; moderate quality of evidence.)
- NHS. Heart attack. (Symptoms including chest pain that may spread to the arm, neck and jaw; the immediate-action list; "Do not drive yourself to A&E"; the urgent-advice list including sudden increased breathlessness and chest pain with a racing, slow or fluttering heartbeat.)
- MedlinePlus. Myocarditis. National Library of Medicine. (Most often caused by an infection reaching the heart, including SARS-CoV-2 and influenza; symptoms including chest pain that may resemble a heart attack, fatigue, fever, rapid breathing, rapid heart rate, leg swelling and fainting; "can be hard to diagnose because the signs and symptoms often mimic those of other heart and lung diseases, or a bad case of the flu".)
- Cleveland Clinic. Myocarditis, last updated 31 March 2025. ("People with myocarditis often feel fatigued, short of breath, chest pain or the sensation of their heart racing"; symptoms arriving gradually or very quickly.)
- MedlinePlus. Breathing difficulty. National Library of Medicine. (Emergency criteria when breathing difficulty comes on suddenly or interferes with breathing or talking; cardiac, pulmonary and haematological causes including pulmonary embolism, heart failure, arrhythmia and anaemia.)
- Baron KG, Abbott S, Jao N, Manalo N, Mullen R. Orthosomnia: Are Some Patients Taking the Quantified Self Too Far? J Clin Sleep Med. 2017;13(2):351-354.
