What does "accurate" mean for a cortisol wearable?
Two different things, and a good validation answers both.
- Does it follow your day? Cortisol rises sharply after waking, falls through the afternoon and reaches its floor overnight. The first question is whether a wearable's readings rise and fall with yours, at the right times and in the right proportion.
- Does its number match the lab's? The second is whether the value it reports is the value a laboratory would report for the same moment.
They can pass or fail separately. A sensor can track your rhythm faithfully while reading a little high, or match the lab on average while missing the shape of your morning. Cortisol varies so widely between people that a population range says little about any one of them, so for a personal baseline the first question matters most: your own curve has to be right before a comparison against it means anything.
What should a sweat reading be compared with?
Free cortisol, measured by a laboratory. Most cortisol in blood is bound to carrier proteins and unavailable to tissue. Sweat carries the unbound, free fraction. A standard blood test usually reports the total, bound and free together, so it measures a different quantity. When binding proteins change, total and free cortisol can point in different directions, as a New England Journal of Medicine study of critically ill patients showed in 2004.
Two references measure the right thing:
- The sweat itself, collected alongside the sensor. This isolates the sensor: same fluid, same moment, two ways of measuring it.
- Timed saliva, which also carries free cortisol and has been the standard way to sample it through a day in research for decades. It shows whether the wearable follows the body, not only the drop of sweat in front of it.
The laboratory method matters too. Liquid chromatography with tandem mass spectrometry (LC-MS/MS) separates cortisol from similar molecules before measuring it, which is why it is the reference method for steroid hormones. Immunoassays are cheaper and widely used, but antibodies can cross-react with related steroids and read high.
Timing has to be matched. Sweat takes time to travel from the gland to a sensor. A fair comparison pairs each laboratory sample with the reading that saw that same sweat, not with whatever the device showed at the clock time the sample was taken. A study that skips this step will understate a good sensor and can flatter a poor one.
Why isn't a correlation enough?
Because correlation measures whether two sets of numbers move together, not whether they agree. A sensor that always reads double the true value has a perfect correlation and is wrong every time. Statisticians Martin Bland and Douglas Altman made this point in The Lancet in 1986, and their method, which looks directly at the differences between two measurements, became the standard way to compare a new method with an established one.
Pooling makes it worse. People differ a great deal in their cortisol levels, so a scatter plot of many people's readings can show a strong correlation driven by the gaps between people, even when no single person's day is tracked well. Bland and Altman returned to this in 1995: the relationship that matters for a personal device is the one within each person.
Which numbers should a validation report?
One headline number hides too much. A complete report puts these side by side:
- Bias. Whether readings run high or low on average compared with the reference, and by how much.
- Limits of agreement. The range that 95% of the differences fall within. This is the number that tells you how far a single reading can be off.
- Mean absolute relative difference (MARD). The average gap between reading and reference, as a percentage. It is the figure continuous glucose sensors are usually quoted with, and it is useful only beside the two above, since an average can hide large individual errors.
- Coverage. How many readings the device reported at all. A sensor that withholds its hardest readings can post a better average than one that reports every one.
- Results per person. How well the typical wearer did, and how well nearly every wearer did. An average can look fine while some people get poor readings.
- The conditions. At rest or in exercise, across the morning peak and the evening low, on the first day of a sensor and on its last.
Mature categories formalise this. In the United States, glucose sensors cleared to connect with insulin pumps and other devices must meet accuracy requirements set across low, normal and high ranges under a federal regulation, rather than a single overall figure. Cortisol wearables are early enough that no equivalent standard exists, which makes the questions below more useful.
What should you ask before trusting a cortisol reading?
- What was it compared with? Free cortisol in sweat or saliva, or a blood total?
- How was the reference measured? LC-MS/MS, or an immunoassay?
- Were the samples matched in time to the readings that saw the same sweat?
- Does the report show bias and limits of agreement, or only a correlation?
- Were people wearing it through a normal day, or were samples tested in a lab dish?
- Are results shown for each person, or only pooled across everyone?
- Is the method published beside the number? A figure with no method attached cannot be checked.
These apply to any device that claims to read a hormone, including ours.
Where does the Auromone Curve stand?
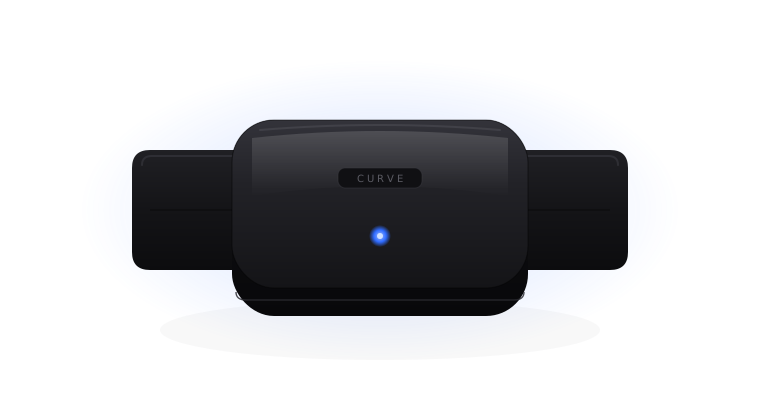
At the start, and we would rather say so plainly. The Auromone Curve is designed to read cortisol from sweat continuously and build your own curve from those readings. It is a general wellness device in development. It has not been validated against a laboratory reference, and we publish no accuracy figure for it. Its validation follows the stages below, each checked against the references described above.
| Stage | The question | Checked against | Status |
|---|---|---|---|
| Stage 1On the bench | Does the sensor respond to cortisol in proportion to how much is there, across the range found in human sweat, from the overnight low to the morning peak? Does it ignore the hormones closest to cortisol in structure? | Known amounts of pure cortisol, and of the related hormones it must not be mistaken for | In progress |
| Stage 2In real sweat | Does that response hold in sweat, with its salts, proteins and everything else a lab solution doesn't have? | Real sweat with a known amount of cortisol added, and the same samples measured by a laboratory | Next to show |
| Stage 3On the wrist | Does the Curve follow one person's day: the rise after waking, the fall through the afternoon, the evening low? | Collected sweat and timed saliva across the day, measured by LC-MS/MS | Next to show |
| Stage 4Across a full wear | Do the readings hold up from the first day of a sensor to its last? | The same comparison as stage 3, repeated through the sensor's whole wear window | Next to show |
When a stage finishes, its result will appear on this page with the method behind it, reported in the terms above. Some detail of how the sensor is made is held back while patent filings are in progress; the principles it rests on are on the science page and in how a wearable biosensor reads chemistry.
References
- Bland JM, Altman DG. Statistical methods for assessing agreement between two methods of clinical measurement. The Lancet. 1986;1(8476):307-310. (Why correlation does not show agreement; bias and limits of agreement.)
- Bland JM, Altman DG. Calculating correlation coefficients with repeated observations: Part 1, correlation within subjects. BMJ. 1995;310(6977):446. (Pooled correlations across people differ from the relationship within each person.)
- Hamrahian AH, Oseni TS, Arafah BM. Measurements of serum free cortisol in critically ill patients. New England Journal of Medicine. 2004;350(16):1629-1638. (Total cortisol misrepresenting free cortisol when binding proteins are low.)
- Kirschbaum C, Hellhammer DH. Salivary cortisol in psychoneuroendocrine research: recent developments and applications. Psychoneuroendocrinology. 1994;19(4):313-333. (Saliva as a measure of free cortisol through the day.)
- Taylor AE, Keevil B, Huhtaniemi IT. Mass spectrometry and immunoassay: how to measure steroid hormones today and tomorrow. European Journal of Endocrinology. 2015;173(2):D1-D12. (LC-MS/MS against immunoassay for steroid hormones, including cross-reactivity.)
- Heikenfeld J, Jajack A, Feldman B, et al. Accessing analytes in biofluids for peripheral biochemical monitoring. Nature Biotechnology. 2019. (Sweat as a biofluid: how fast it is made and how much it dilutes what blood carries.)
- Torrente-Rodríguez RM, Tu J, Yang Y, et al., Gao W. Investigation of cortisol dynamics in human sweat using a graphene-based wireless mHealth system. Matter. 2020. (An early wearable study of sweat cortisol across the day.)
- U.S. Food and Drug Administration. 21 CFR 862.1355, Integrated continuous glucose monitoring system. (Accuracy requirements set across glucose ranges for one class of glucose sensor.)
This page is for general education and is not medical advice. The Auromone Curve is designed as a general wellness device, not a diagnostic, and does not replace clinical testing. It is in development and not yet on sale.